
Teagasc Crop Report
Harvest Report 2026
Harvest Report 2026
To view the full report you must have an existing account with Teagasc ConnectEd.
Farmers sign in hereAlready have a ConnectEd account? Connected Client or Teagasc staff log in here
Headlines
- Cereal production fell 11% to 1.997 million tonnes, below the five-year average of 2.162 million tonnes. Winter wheat production dropped by around 100,000 tonnes, with average yields 1 t/ha lower than in 2025.
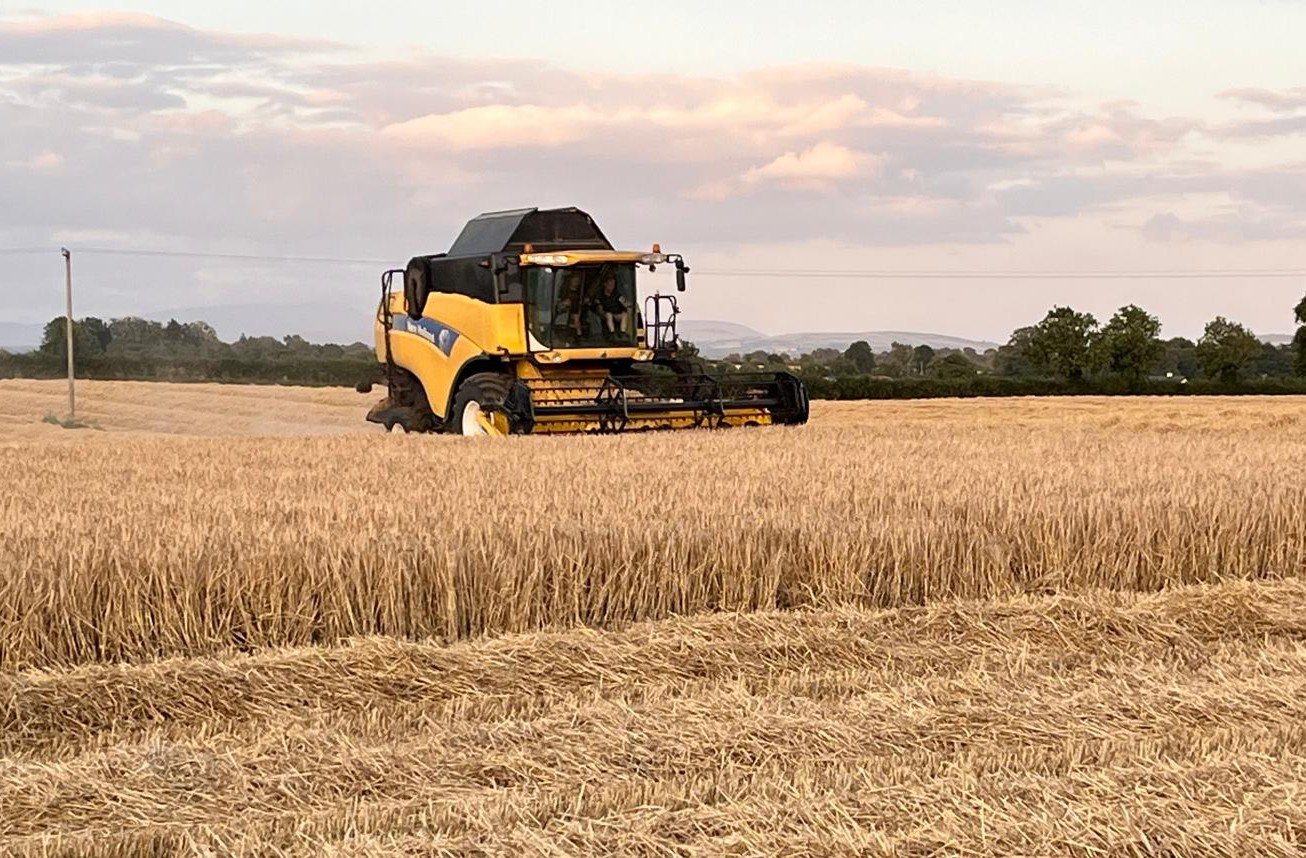
- Weather reduced yields but favoured harvest conditions. A mild, wet winter and wet early spring conditions increased BYDV and take-all pressure in susceptible crops and delayed fieldwork and sowing. Hot, dry weather from the end of May through to harvest accelerated crop development and brought harvest forward by two to three weeks for many growers.
- Yields were below five-year averages for all crops except winter oilseed rape, which yielded 5.1 t/ha. Winter barley showed the greatest yield variation, from below 7 to 11 t/ha.
- Harvest grain moisture was below average, particularly in winter and spring barley. As a result yields should be interpreted with caution when compared with previous harvests.
- Cereal area fell by 6.3% to 257,000 ha, while the total tillage area declined by 2.3%, supported by increases in winter oilseed rape, beans and maize. Spring bean area rose 17% to 15,700 ha and winter oilseed rape area rose 59.4% to 18,100 ha.
Cereal, WOSR and Spring Bean Production 2026
| Crop | 2026¹ (‘000 ha) |
2025* (‘000 ha) |
Diff (‘000 ha) |
%* | 2026** (t/ha) |
2025* (t/ha) |
2026 ('000 t) |
2025 * ('000 t) |
Diff |
Diff % |
|---|---|---|---|---|---|---|---|---|---|---|
| W. Wheat | 54.9 | 59.7 | -4.8 | -8% | 9.47 | 10.50 | 495 | 596 | -100.9 | -17% |
| S. Wheat | 3.7 | 4.7 | -1.0 | -20% | 7.37 | 7.40 | 26 | 33 | -6.8 | -21% |
| W. Barley | 60.0 | 57.3 | 2.7 | 5% | 8.51 | 9.20 | 485 | 501 | -15.8 | -3% |
| S. Barley | 109.5 | 115.3 | -5.8 | -5% | 7.36 | 7.30 | 765 | 800 | -34.4 | -4% |
| W. Oats | 12.0 | 18.0 | -6.0 | -33% | 8.75 | 9.10 | 100 | 156 | -55.8 | -36% |
| S. Oats | 12.2 | 15.9 | -3.7 | -23% | 7.14 | 7.50 | 83 | 113 | -30.3 | -27% |
| W. Rye | 4.9 | 3.7 | 1.2 | 31% | 9.25 | 10.30 | 43 | 36 | 6.6 | 18% |
| Total Cereals | 257 | 275 | -17.3 | -6.3% | 1997 | 2234 | -237.4 | -11% | ||
| WOSR | 18.1 | 11.2 | 6.9 | 62% | 5.08 | 5 | 88 | 53 | 34.4 | 65% |
| S Beans | 15.7 | 13.4 | 2.3 | 17% | 3.95 | 5 | 59 | 64 | -4.7 | -7% |
1 Preliminary DAFM BPS figures
* CSO 2025 Area, Yield and Production of Crops
** Teagasc estimates
$ Yields x Utilisable Area (Area x 0.95)
Indicative Variable Cost of Production, based on 2026 Yields
The cost of producing a tonne of grain has increased significantly in recent years especially the three largest costs on tillage farms of fertiliser, machinery and land rent. The table below uses the average yields from harvest 2026 to estimate production costs.
Cost per tonne is calculated by dividing Teagasc Crops Costs and Returns 2026 variable costs per hectare by the Teagasc 2026 harvest report yield. It is an indicative variable cost, not a full cost of production or break-even price. Land rent and fixed costs including lime, land maintenance, jeep etc.are not included.
Straw income is not deducted. For beans, protein aid is excluded from the table. At the 2026 yield of 3.9 t/ha, and an estimated protein aid payment of €500/ha this is equivalent to approximately €128/t. The payment would reduce the indicative cost after protein aid from €280/t to approximately €152/t.
| Crop | ²Total variable costs (€/ha) | ³Yield (t/ha) | ¹Cost/t |
|---|---|---|---|
| Winter Wheat | 1839 | 9.5 | 194 |
| Spring wheat | 1502 | 7.4 | 204 |
| Winter Barley | 1707 | 8.5 | 201 |
| Spring Barley | 1393 | 7.4 | 188 |
| Winter Oats | 1425 | 8.8 | 163 |
| Spring Oats | 1375 | 7.1 | 194 |
| Winter Rye | 1669 | 9.3 | 180 |
| Winter OSR | 1540 | 5.1 | 302 |
| ⁴Spring Beans | 1092 | 3.9 | 280 |
¹Cost/t excludes income from straw
²Total variable costs (€/ha) taken from Teagasc Crops costs and returns 2026
³Yield (t/ha) from Teagasc harvest report
⁴Beans does not include protein aid. €500/ha payment equivalent to €128/t based on 2026 yield.
Winter Wheat
The area of winter wheat decreased in 2026 down from 59,700 ha in 2025 to 54,900 ha recorded this year, which is an decrease of 4,800 ha. Due to the wet winter months, many crops did not get autumn herbicides on post emergence and had to wait until spring for weed control, they did not receive an aphicide either which did have an impact on some crops during the spring. Weather in the early spring was also wet however most crops did get the early fertiliser applications on in time, it was however noticeable that some early maturing varieties e.g. Rebellion were very advanced which made timing of critical applications somewhat tricky. High temperatures combined with a lack of rainfall at critical times in May, June and early July put a lot of stress on crops which meant that most were harvested weeks earlier than would normally be the case. This did affect yields to varying degree depending on the area and soil type. Drier fields in the south east suffered most while cooler areas in the north east particularly suffered least.
Crop inputs - T0's were applied in almost all crops due to the pressure in April from yellow rust, the changing ratings of many of the popular varieties and the experience from 2025 meant that most growers were unwilling to take a chance of not putting one on. Septoria was not an issue in 2026 due to the drought, although there was septoria present in all crops at relatively low levels it never got a chance to spread due mainly to the weather but also due to fungicide applications being applied on time.
Yields - The average yield of 9.47 t/ha is below the 5 year average of 9.9 t/ha. However this masks the wide range in yields experienced around the country, counties worst affected by the weather, i.e. the midlands and south east, reported yields as low as 6.5t/ha whereas areas of the north east recorded yields touching 12 t/ha. Overall the winter wheat total output was down circa 100,000 t from 2025 which is the single biggest reason for the reduced total harvest tonnage in 2026.
Average grain moisture at harvest was 16.3% and hectolitre weight decreased slightly from last year at 74.4.1 kg/hl. Crops by enlarge were harvested two to three weeks earlier than normal.
Spring Wheat
The area of spring wheat also decreased slightly by 1,000 ha to 3,700 ha. There were few opportunities in February and early March to drill crops as land was still wet, which meant most crops were drilled in the second half of March. Cork and Wexford accounted for almost half of the area drilled in 2026. Again disease levels were low and most crops were harvested in early to mid August.
Yields ranged from 5 - 9 t/ha with the average being 7.5t/ha, with the average moisture of 17% and the hectolitre weight was 71.8 kg/hl.
Winter Barley
The area of winter barley harvested in 2026 increased from 57,300 ha in 2025 to approximately 59,962 ha in 2026. The combination of favourable weather conditions last autumn and the increased availability of BYDV tolerant varieties was no doubt a factor. Many crops were treated pre-emergence for weeds but many who waited until November to apply a post-emergence herbicide with an insecticide failed to do so and this was to cause issues in the spring. Again the wet weather in February and early March delayed nitrogen applications on all but the driest of land and this had an impact on tiller numbers and consequently yield. Symptoms of BYDV also started to show in both the tolerant and conventional varieties although the damage in the tolerant varieties was much less.
Crop inputs - timing of many crucial crop inputs such as fertiliser, pgr's, trace elements, wild oat herbicides and fungicides was tricky this spring as weather conditions to apply them proved difficult. This had the impact that many mixtures of inputs had to be put on together with some scorch being observed. Again due to the dry conditions disease levels were low even though diseases like net blotch and rynchosporium tend to affect crops early in the season.
Yields - were mainly affected by the near record temperatures in May more so that the drought in late June and July although practically all crops were still harvested in the first half of July. The average yield of 8.51 t/ha is slightly lower than the 5 year average of 8.6 t/ha with many being harvested at very low moistures as low as 10-11% in some cases and the average hectolitre weight was 65 kg/hl.
Spring Barley
The area of spring barley also fell in 2026 to 109,500 ha down from 115,300 ha in 2025, this highlights the continued decline in the overall tillage area within the country. Drilling started in March in relatively good conditions on lighter soils in the south east and the north of the country finished in mid April conditions for the most part were good and crops established reasonably well. Again the temperatures in late May had a significant impact on crop growth particularly on the earlier drilled crops where it was obvious that tillers were lost due to stress, this seemed to have a much lesser effect on the later drilled crops on the heavier land. Disease levels across the board were low although BYDV infections were high. Many crop in the east an south east had little or no rainfall from the last week of June until they were harvested which had an impact on yield.
Harvest of spring barley began in the last 10 days of July with many farms being finished before the end of the month. Harvest conditions were ideal with straw able to be baled directly behind combines. However thrashing of some crops was an issue with screenings being reported as being high in some crops, this in turn led to very high rejections of malting barley up to 100% on many farms in some areas.
Yields - there were four distinct areas within the country where reported yields varied substantially, (a) the midlands and south east where the drought was at it worst yield were the lowest, (b) the south was not a badly affected, (c) the northeast had the highest yields on the heavier soils had the highest yields and (d) the fourth area was the north west where continued rainfall throughout August and September delayed the harvest and also affected yields. While the overall average yields of 7.36 t/ha is slightly above the 5 year average of 7.3 t/ha it doesn't highlight the range of yields achieved in many areas, yields as low as 2.25 t/ha were experienced in some of the worst drought affected areas whereas yields up to 10 t/ha were achieved in one or two areas. Moistures again ranged from 10 - 24 % with the average of about 16%. Hectolitre weight averaged 65 kg/hl.
Winter Oats
The area of winter oats showed the highest decrease in the planted area of any crop at 33%, in 2026 12,009 ha were planted down from 18,000 ha in 2025. This decrease in the area planted is as a direct result of the collapse in the demand for oats with 2024 crop still unsold at the time of planting in 2025 many growers were discouraged from planting crops. However, those that were planted seemed to emerge relatively well from the winter and the had a relatively trouble free spring until late May. Again those high temperatures at the end of May stressed the crop enormously and the subsequent dry weather at the end of June forced the crop like many others to ripen early.
Yields - ranged from 6.9 t/ha up to 10.8 t/ha with the average across the country at about 8.75 t/ha, this is slightly below the 5 year average of 8.6 t/ha.
The average moisture was 15.5 % and the average hectolitre weight was 54.6.
Spring Oats
Spring oats also decreased in area due to the difficult market conditions and difficult conditions at drilling, an area of 12,200 ha was recorded by DAFM in 2026 down from 15,900 ha in 2025. Again much of the crop was planted later that would be ideal in late March/early April. Crops established well like most spring crops this year but then suffered in May, June and July. By the end of August practically all crops were harvested which is about 2-3 weeks ahead of normal.
Yields - the crop averaged 7.14 t/ha which is well below the 5 year average of 7.5 t/ha, the average moisture at harvest was about 18%.
Winter Rye
The area of winter rye continues to buck the trend with the area increasing again in 2026, at 4,900 ha up from 3,700 ha in 2025 this represents a 31% increase in the area sown which in turn comes on the back of a 38% increase in 2025 from 2024. The increased popularity is driven by the lower cost of growing the crop when compared to wheat, however at merchant level it can prove difficult to market hence it is typically trading below barley price.
Winter Oilseed Rape
The area planted for harvest saw a 62% increase compared to 2025, an area of 18,100 ha was drilled in autumn 2025 due no doubt to the good price of oilseed rape at the time compared to cereals and the good sowing conditions. This was the highest area planted since 2023 and with continued stron market sentiment there may well be further increase in the area for harvest 2027.
Yields - crops were again one of star performers in harvest 2026 with crops averaging 5.08t/ha slightly above the 5 year average of 5.0 t/ha. Moistures were very low with some being harvested a 6% however the average was about 9%.
Spring Beans
The area of beans increased from 13,400 ha in 2025 to 15,700 ha in 2026 a 17% increase from 2025. The continued protein payment support continues to make protein crops attractive when compared to cereals. The dry weather in June and July probably affect crops more than any other with evidence in some crops of flowers not forming properly due to the extreme temperatures. Beans do not like drought and so performed poorly on many farms.
Yields - the average yield of 3.95 t/ha is well below the 5 year average of 5.2 t/ha, however many crops yielded well below 2.0t/ha (0.8 t/ac) and the average moisture was 17.6%. This autumn there seems to be increased interest in winter beans as these are seen potentially suffering less from summer droughts.
Straw
Favourable weather during the 2026 harvest allowed farmers to bale straw with minimal additional costs and losses associated with broken harvest conditions. Straw quality was excellent, and field and baling losses were very low.
Demand for straw was sluggish initially. However, demand increased as dry conditions persisted through the summer. In response, many farmers withdrew land from the Straw Incorporation Measure (SIM) to bale straw for sale.
73,172 hectares of cereal and oilseed rape were initially submitted for chopping and incorporation under SIM. The area figures below are application figures and the final payable area is expected to be lower following withdrawals from the scheme.
| Crop | Area applied for (ha) |
|---|---|
| Winter wheat | 14,781 |
| Winter barley | 5,202 |
| Winter oats | 8,337 |
| Spring wheat | 1,627 |
| Spring barley | 18,845 |
| Spring oats | 8,272 |
| Rye | 1,209 |
| Winter oilseed rape | 14,318 |
| Spring oilseed rape |
581 |
| Total | 73,172 |
Winter Crop Area for Harvest 2027
Weather conditions have remained suitable for planting winter crops this autumn, through to the end of the first week of November. A survey of Teagasc advisers and seed companies suggests that the area sown for harvest in 2027 has increased slightly compared with the previous two seasons.
The survey indicates that areas of winter wheat and barley have declined slightly, while oats have returned to more normal levels. Rye and oilseed rape areas are estimated to have increased significantly, by 38% and 18%, respectively.
| 2024 | 2025 | 2026 | 2027* | |
|---|---|---|---|---|
| Winter Wheat | 40.6 | 59.7 | 54.9 | 52.7 |
| Winter Barley | 43.3 | 57.3 | 59.9 | 57.4 |
| Winter Oats | 7.5 | 18.0 | 12.0 | 14.2 |
| Winter Rye | 2.7 | 3.8 | 4.9 | 6.7 |
| Winter Oilseed Rape | 15.1 | 11.2 | 18.1 | 21.4 |
| Total | 109.2 | 150.0 | 149.8 | 152.4 |
*Teagasc estimates
Note: Thanks to all our colleagues and industry partners/stakeholders who contributed to this report.